This information will no longer be updated and has been superseded by the UK Kidney Association data portals which can be found here.
Table 1. Estimated coverage of CCGs
In the most recent quarter covered by this table (Q3 2020), 174 of 189 (92%) pathology laboratories in England have provided sufficient data on AKI to be included in the calculation of the AKI episode rate by CCG. 84 CCGs have an AKI episodes rate confidence of GREEN, 41 of AMBER and 10 of RED.
You can now read your report by clicking on the codes. This will allow you to download the PDF of each CCG’s report.
How to interpret the confidence rating
GREEN – where we are confident that all the labs serving this CCG population provided data for this period. This means that all labs in the CCG, and all labs in neighbouring CCGs, provided data. Where a CCG does not have a home laboratory, all neighbouring CCG’s need to have a GREEN coverage for the CCG to be deemed as covered.
AMBER – where only some of the labs serving this CCG population provided data for this period. The labs within the CCG provided data but not all the neighbouring CCG labs. Data for people living towards the boundaries of the CCG may well be missing. Where a CCG does not have a home laboratory and not all neighbouring CCG’s have an GREEN coverage, the CCG is deemed to have an AMBER coverage.
RED – where we have little or no data from the labs covering the CCG population for this period. This is because at least one of the labs within the CCG has not provided data.
CCG code CCG name Q1 2020 Q3 2020 Q3 2020 status E38000004 NHS Barking and Dagenham CCG E38000004 E38000004 G E38000006 NHS Barnsley CCG E38000006 E38000006 G E38000007 NHS Basildon and Brentwood CCG E38000007 E38000007 G E38000008 NHS Bassetlaw CCG E38000008 E38000008 G E38000231 NHS Bath and North East Somerset, Swindon and Wiltshire CCG E38000231 E38000231 R E38000010 NHS Bedfordshire CCG E38000010 E38000010 R E38000221 NHS Berkshire West CCG E38000221 E38000221 A E38000220 NHS Birmingham and Solihull CCG E38000220 E38000220 A E38000014 NHS Blackburn with Darwen CCG E38000014 E38000014 G E38000015 NHS Blackpool CCG E38000015 E38000015 G E38000016 NHS Bolton CCG E38000016 E38000016 G E38000232 NHS Bradford District and Craven CCG E38000232 E38000232 G E38000020 NHS Brent CCG E38000020 E38000020 A E38000021 NHS Brighton and Hove CCG E38000021 E38000021 G E38000222 NHS Bristol, North Somerset and South Gloucestershire CCG E38000222 E38000222 A E38000223 NHS Buckinghamshire CCG E38000223 E38000223 A E38000024 NHS Bury CCG E38000024 E38000024 G E38000025 NHS Calderdale CCG E38000025 E38000025 G E38000026 NHS Cambridgeshire and Peterborough CCG E38000026 E38000026 A E38000028 NHS Cannock Chase CCG E38000028 E38000028 G E38000030 NHS Castle Point and Rochford CCG E38000030 E38000030 G E38000031 NHS Central London (Westminster) CCG E38000031 E38000031 G E38000233 NHS Cheshire CCG E38000233 E38000233 R E38000034 NHS Chorley and South Ribble CCG E38000034 E38000034 G E38000035 NHS City and Hackney CCG E38000035 E38000035 G E38000234 NHS County Durham CCG E38000234 E38000234 G E38000038 NHS Coventry and Rugby CCG E38000038 E38000038 G E38000229 NHS Derby and Derbyshire CCG E38000229 E38000229 A E38000230 NHS Devon CCG E38000230 E38000230 G E38000044 NHS Doncaster CCG E38000044 E38000044 G E38000045 NHS Dorset CCG E38000045 E38000045 A E38000046 NHS Dudley CCG E38000046 E38000046 A E38000048 NHS Ealing CCG E38000048 E38000048 G E38000049 NHS East and North Hertfordshire CCG E38000049 E38000049 A E38000224 NHS East Berkshire CCG E38000224 E38000224 G E38000050 NHS East Lancashire CCG E38000050 E38000050 G E38000051 NHS East Leicestershire and Rutland CCG E38000051 E38000051 G E38000052 NHS East Riding of Yorkshire CCG E38000052 E38000052 G E38000053 NHS East Staffordshire CCG E38000053 E38000053 G E38000235 NHS East Sussex CCG E38000235 E38000235 A E38000059 NHS Fareham and Gosport CCG E38000059 E38000059 G E38000226 NHS Fylde and Wyre CCG E38000226 E38000226 G E38000062 NHS Gloucestershire CCG E38000062 E38000062 A E38000064 NHS Greater Huddersfield CCG E38000064 E38000064 G E38000227 NHS Greater Preston CCG E38000227 E38000227 G E38000068 NHS Halton CCG E38000068 E38000068 A E38000070 NHS Hammersmith and Fulham CCG E38000070 E38000070 G E38000074 NHS Harrow CCG E38000074 E38000074 A E38000077 NHS Havering CCG E38000077 E38000077 G E38000236 NHS Herefordshire and Worcestershire CCG E38000236 E38000236 G E38000079 NHS Herts Valleys CCG E38000079 E38000079 A E38000080 NHS Heywood, Middleton and Rochdale CCG E38000080 E38000080 G E38000082 NHS Hillingdon CCG E38000082 E38000082 A E38000084 NHS Hounslow CCG E38000084 E38000084 G E38000085 NHS Hull CCG E38000085 E38000085 G E38000086 NHS Ipswich and East Suffolk CCG E38000086 E38000086 A E38000087 NHS Isle of Wight CCG E38000087 E38000087 G E38000237 NHS Kent and Medway CCG E38000237 E38000237 R E38000089 NHS Kernow CCG E38000089 E38000089 G E38000091 NHS Knowsley CCG E38000091 E38000091 A E38000225 NHS Leeds CCG E38000225 E38000225 G E38000097 NHS Leicester City CCG E38000097 E38000097 G E38000238 NHS Lincolnshire CCG E38000238 E38000238 G E38000101 NHS Liverpool CCG E38000101 E38000101 R E38000102 NHS Luton CCG E38000102 E38000102 A E38000217 NHS Manchester CCG E38000217 E38000217 A E38000106 NHS Mid Essex CCG E38000106 E38000106 A E38000107 NHS Milton Keynes CCG E38000107 E38000107 A E38000228 NHS Morecambe Bay CCG E38000228 E38000228 G E38000212 NHS Newcastle Gateshead CCG E38000212 E38000212 G E38000113 NHS Newham CCG E38000113 E38000113 G E38000239 NHS Norfolk and Waveney CCG E38000239 E38000239 A E38000240 NHS North Central London CCG E38000240 E38000240 R E38000215 NHS North Cumbria CCG E38000215 E38000215 G E38000117 NHS North East Essex CCG E38000117 E38000117 R E38000118 NHS North East Hampshire and Farnham CCG E38000118 E38000118 G E38000119 NHS North East Lincolnshire CCG E38000119 E38000119 G E38000120 NHS North Hampshire CCG E38000120 E38000120 G E38000121 NHS North Kirklees CCG E38000121 E38000121 G E38000122 NHS North Lincolnshire CCG E38000122 E38000122 G E38000126 NHS North Staffordshire CCG E38000126 E38000126 A E38000127 NHS North Tyneside CCG E38000127 E38000127 G E38000241 NHS North Yorkshire CCG E38000241 E38000241 G E38000242 NHS Northamptonshire CCG E38000242 E38000242 A E38000130 NHS Northumberland CCG E38000130 E38000130 G E38000243 NHS Nottingham and Nottinghamshire CCG E38000243 E38000243 G E38000135 NHS Oldham CCG E38000135 E38000135 G E38000136 NHS Oxfordshire CCG E38000136 E38000136 A E38000137 NHS Portsmouth CCG E38000137 E38000137 G E38000138 NHS Redbridge CCG E38000138 E38000138 G E38000141 NHS Rotherham CCG E38000141 E38000141 G E38000143 NHS Salford CCG E38000143 E38000143 G E38000144 NHS Sandwell and West Birmingham CCG E38000144 E38000144 R E38000146 NHS Sheffield CCG E38000146 E38000146 G E38000147 NHS Shropshire CCG E38000147 E38000147 A E38000150 NHS Somerset CCG E38000150 E38000150 A E38000244 NHS South East London CCG E38000244 E38000244 R E38000153 NHS South East Staffordshire and Seisdon Peninsula CCG E38000153 E38000153 G E38000154 NHS South Eastern Hampshire CCG E38000154 E38000154 G E38000161 NHS South Sefton CCG E38000161 E38000161 A E38000163 NHS South Tyneside CCG E38000163 E38000163 G E38000164 NHS South Warwickshire CCG E38000164 E38000164 G E38000245 NHS South West London CCG E38000245 E38000245 A E38000167 NHS Southampton CCG E38000167 E38000167 G E38000168 NHS Southend CCG E38000168 E38000168 G E38000170 NHS Southport and Formby CCG E38000170 E38000170 G E38000172 NHS St Helens CCG E38000172 E38000172 G E38000173 NHS Stafford and Surrounds CCG E38000173 E38000173 G E38000174 NHS Stockport CCG E38000174 E38000174 A E38000175 NHS Stoke on Trent CCG E38000175 E38000175 G E38000176 NHS Sunderland CCG E38000176 E38000176 G E38000246 NHS Surrey Heartlands CCG E38000246 E38000246 A E38000178 NHS Surrey Heath CCG E38000178 E38000178 G E38000182 NHS Tameside and Glossop CCG E38000182 E38000182 G E38000247 NHS Tees Valley CCG E38000247 E38000247 G E38000183 NHS Telford and Wrekin CCG E38000183 E38000183 G E38000185 NHS Thurrock CCG E38000185 E38000185 G E38000186 NHS Tower Hamlets CCG E38000186 E38000186 G E38000187 NHS Trafford CCG E38000187 E38000187 A E38000188 NHS Vale of York CCG E38000188 E38000188 G E38000190 NHS Wakefield CCG E38000190 E38000190 G E38000191 NHS Walsall CCG E38000191 E38000191 A E38000192 NHS Waltham Forest CCG E38000192 E38000192 A E38000194 NHS Warrington CCG E38000194 E38000194 A E38000195 NHS Warwickshire North CCG E38000195 E38000195 G E38000197 NHS West Essex CCG E38000197 E38000197 A E38000198 NHS West Hampshire CCG E38000198 E38000198 A E38000200 NHS West Lancashire CCG E38000200 E38000200 G E38000201 NHS West Leicestershire CCG E38000201 E38000201 G E38000202 NHS West London CCG E38000202 E38000202 A E38000204 NHS West Suffolk CCG E38000204 E38000204 R E38000248 NHS West Sussex CCG E38000248 E38000248 G E38000205 NHS Wigan Borough CCG E38000205 E38000205 G E38000208 NHS Wirral CCG E38000208 E38000208 A E38000210 NHS Wolverhampton CCG E38000210 E38000210 A
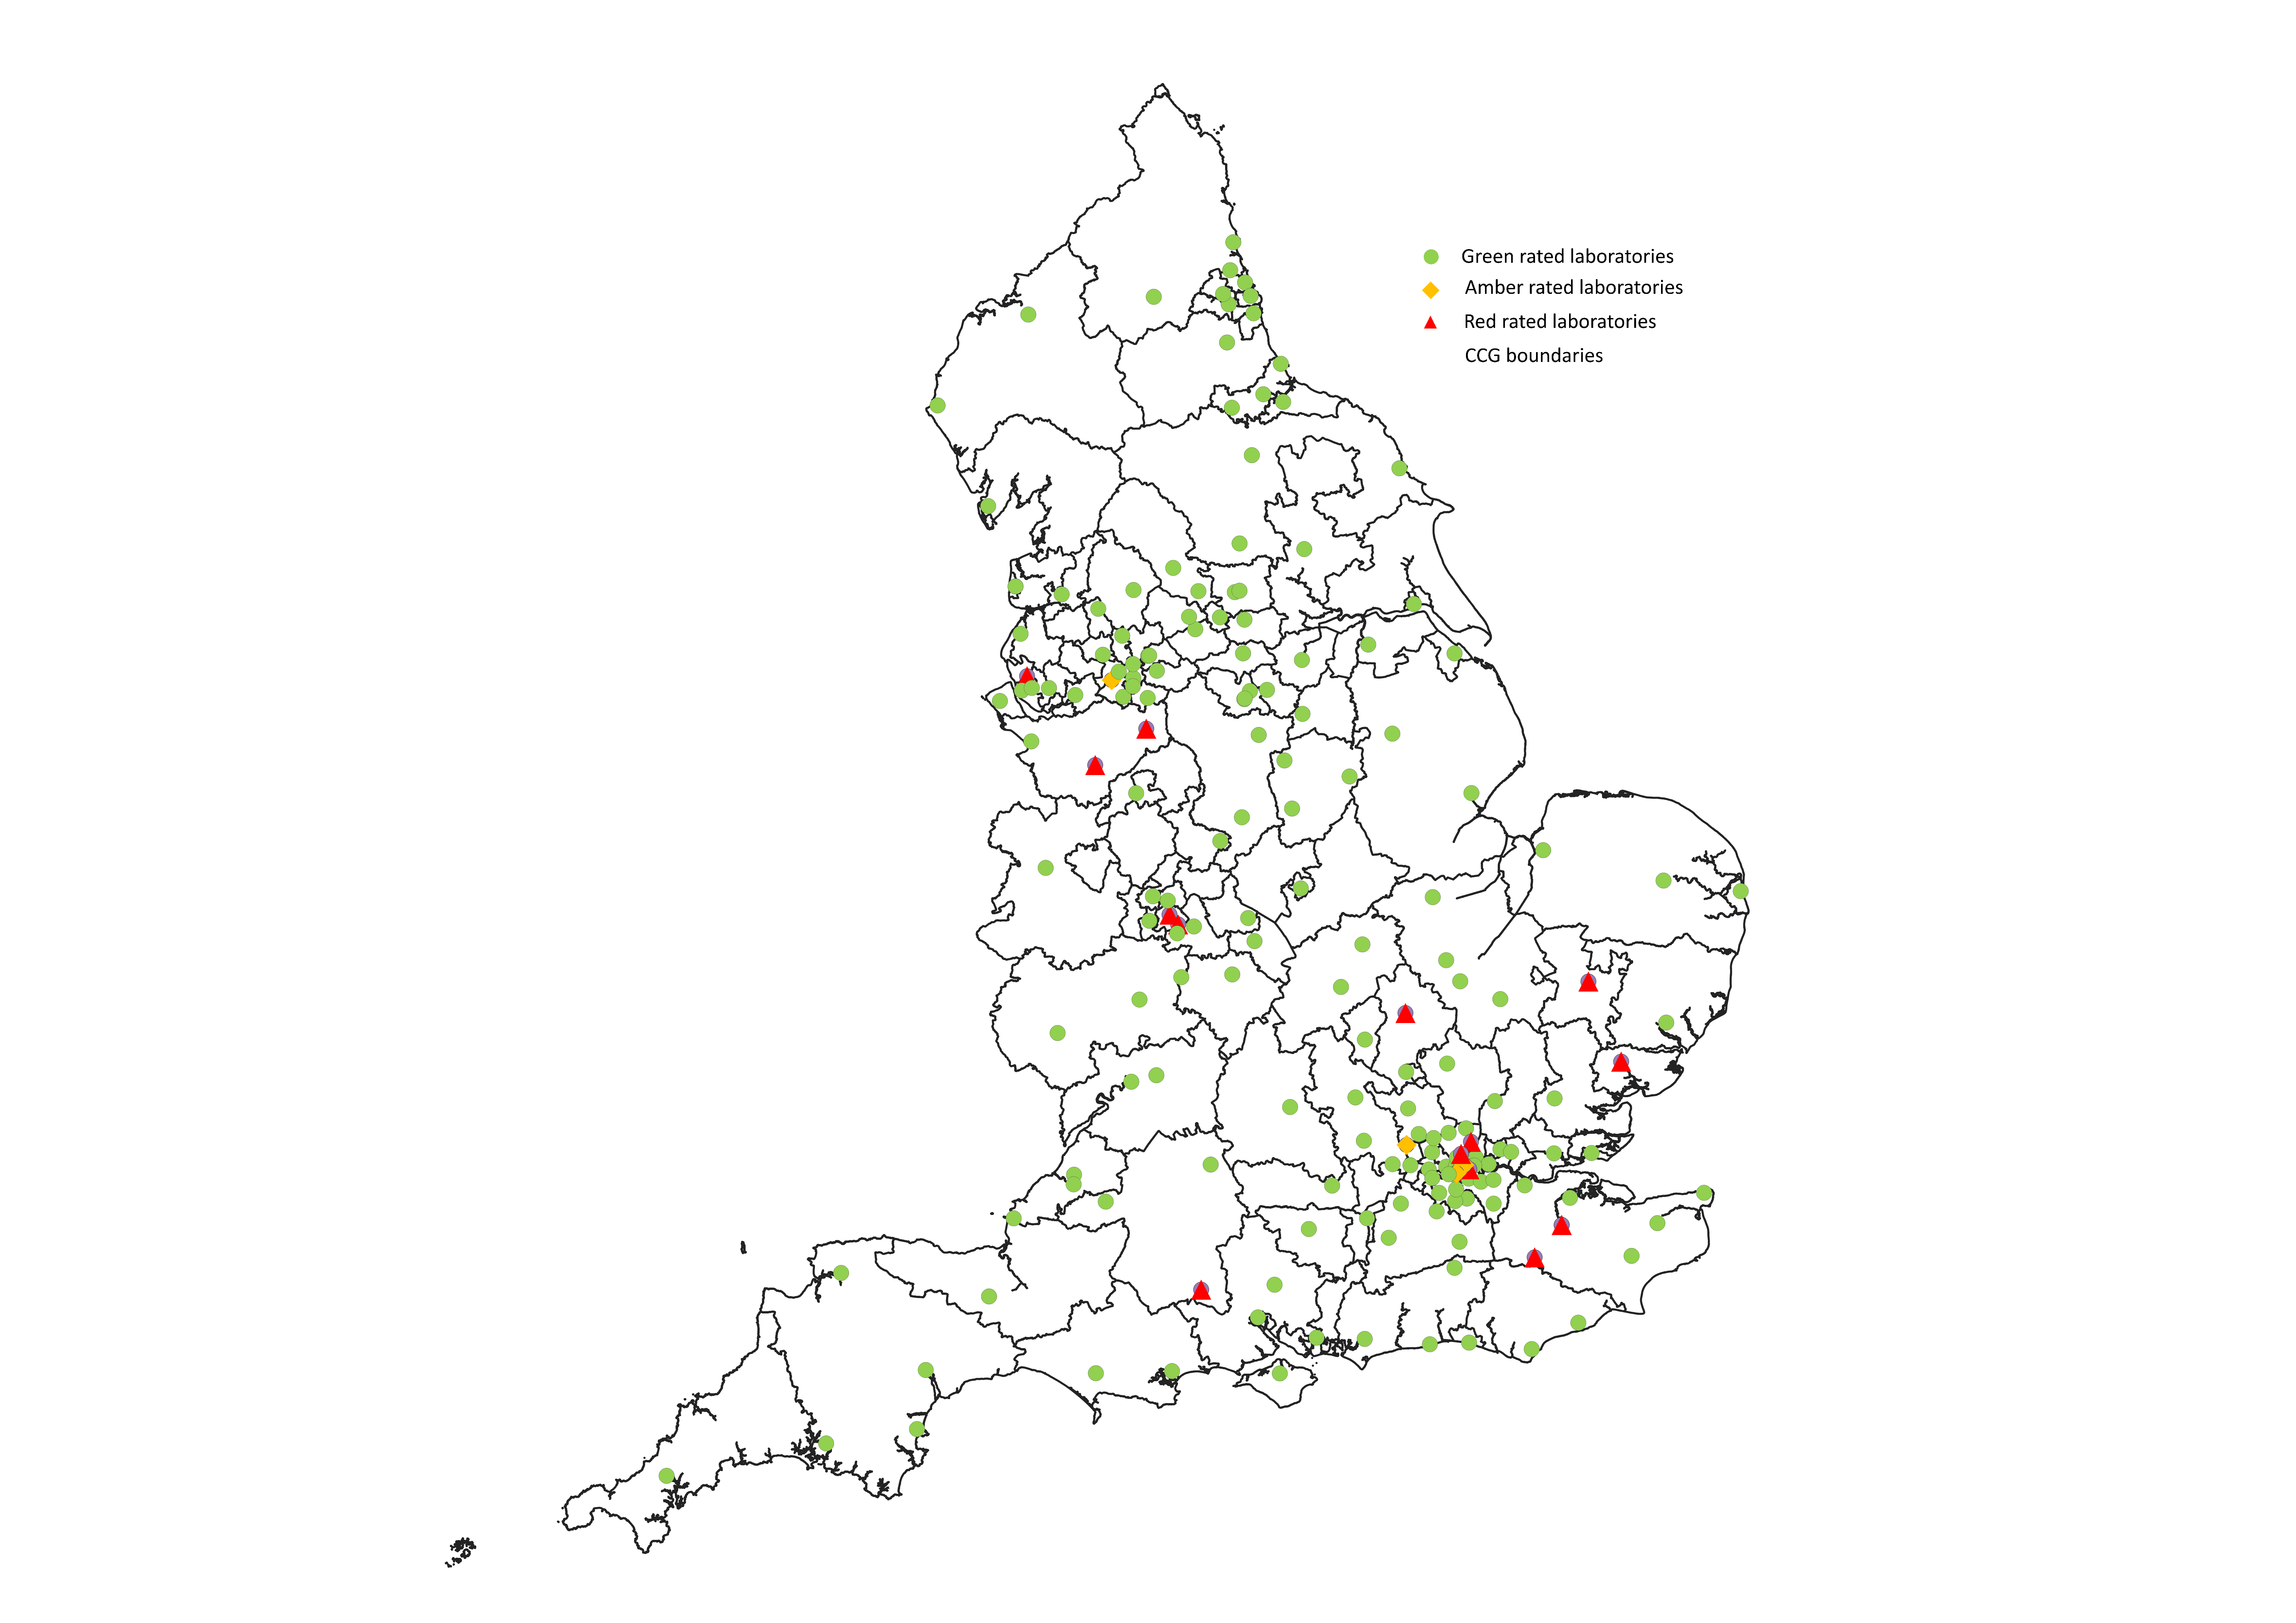
Figure 1. Map of laboratories submitting data of sufficient quality to the UK Renal Registry
The green circles present laboratories submitting AKI alert data of sufficient quality to be included in the calculation of the AKI episode rate in the period July 2020 to September 2020. The red triangles indicate laboratories that are either not submitting data to the UKRR or submitting data of insufficient quality/completeness and could not be included in the AKI episodes rate calculation for quarter 3 of 2020.
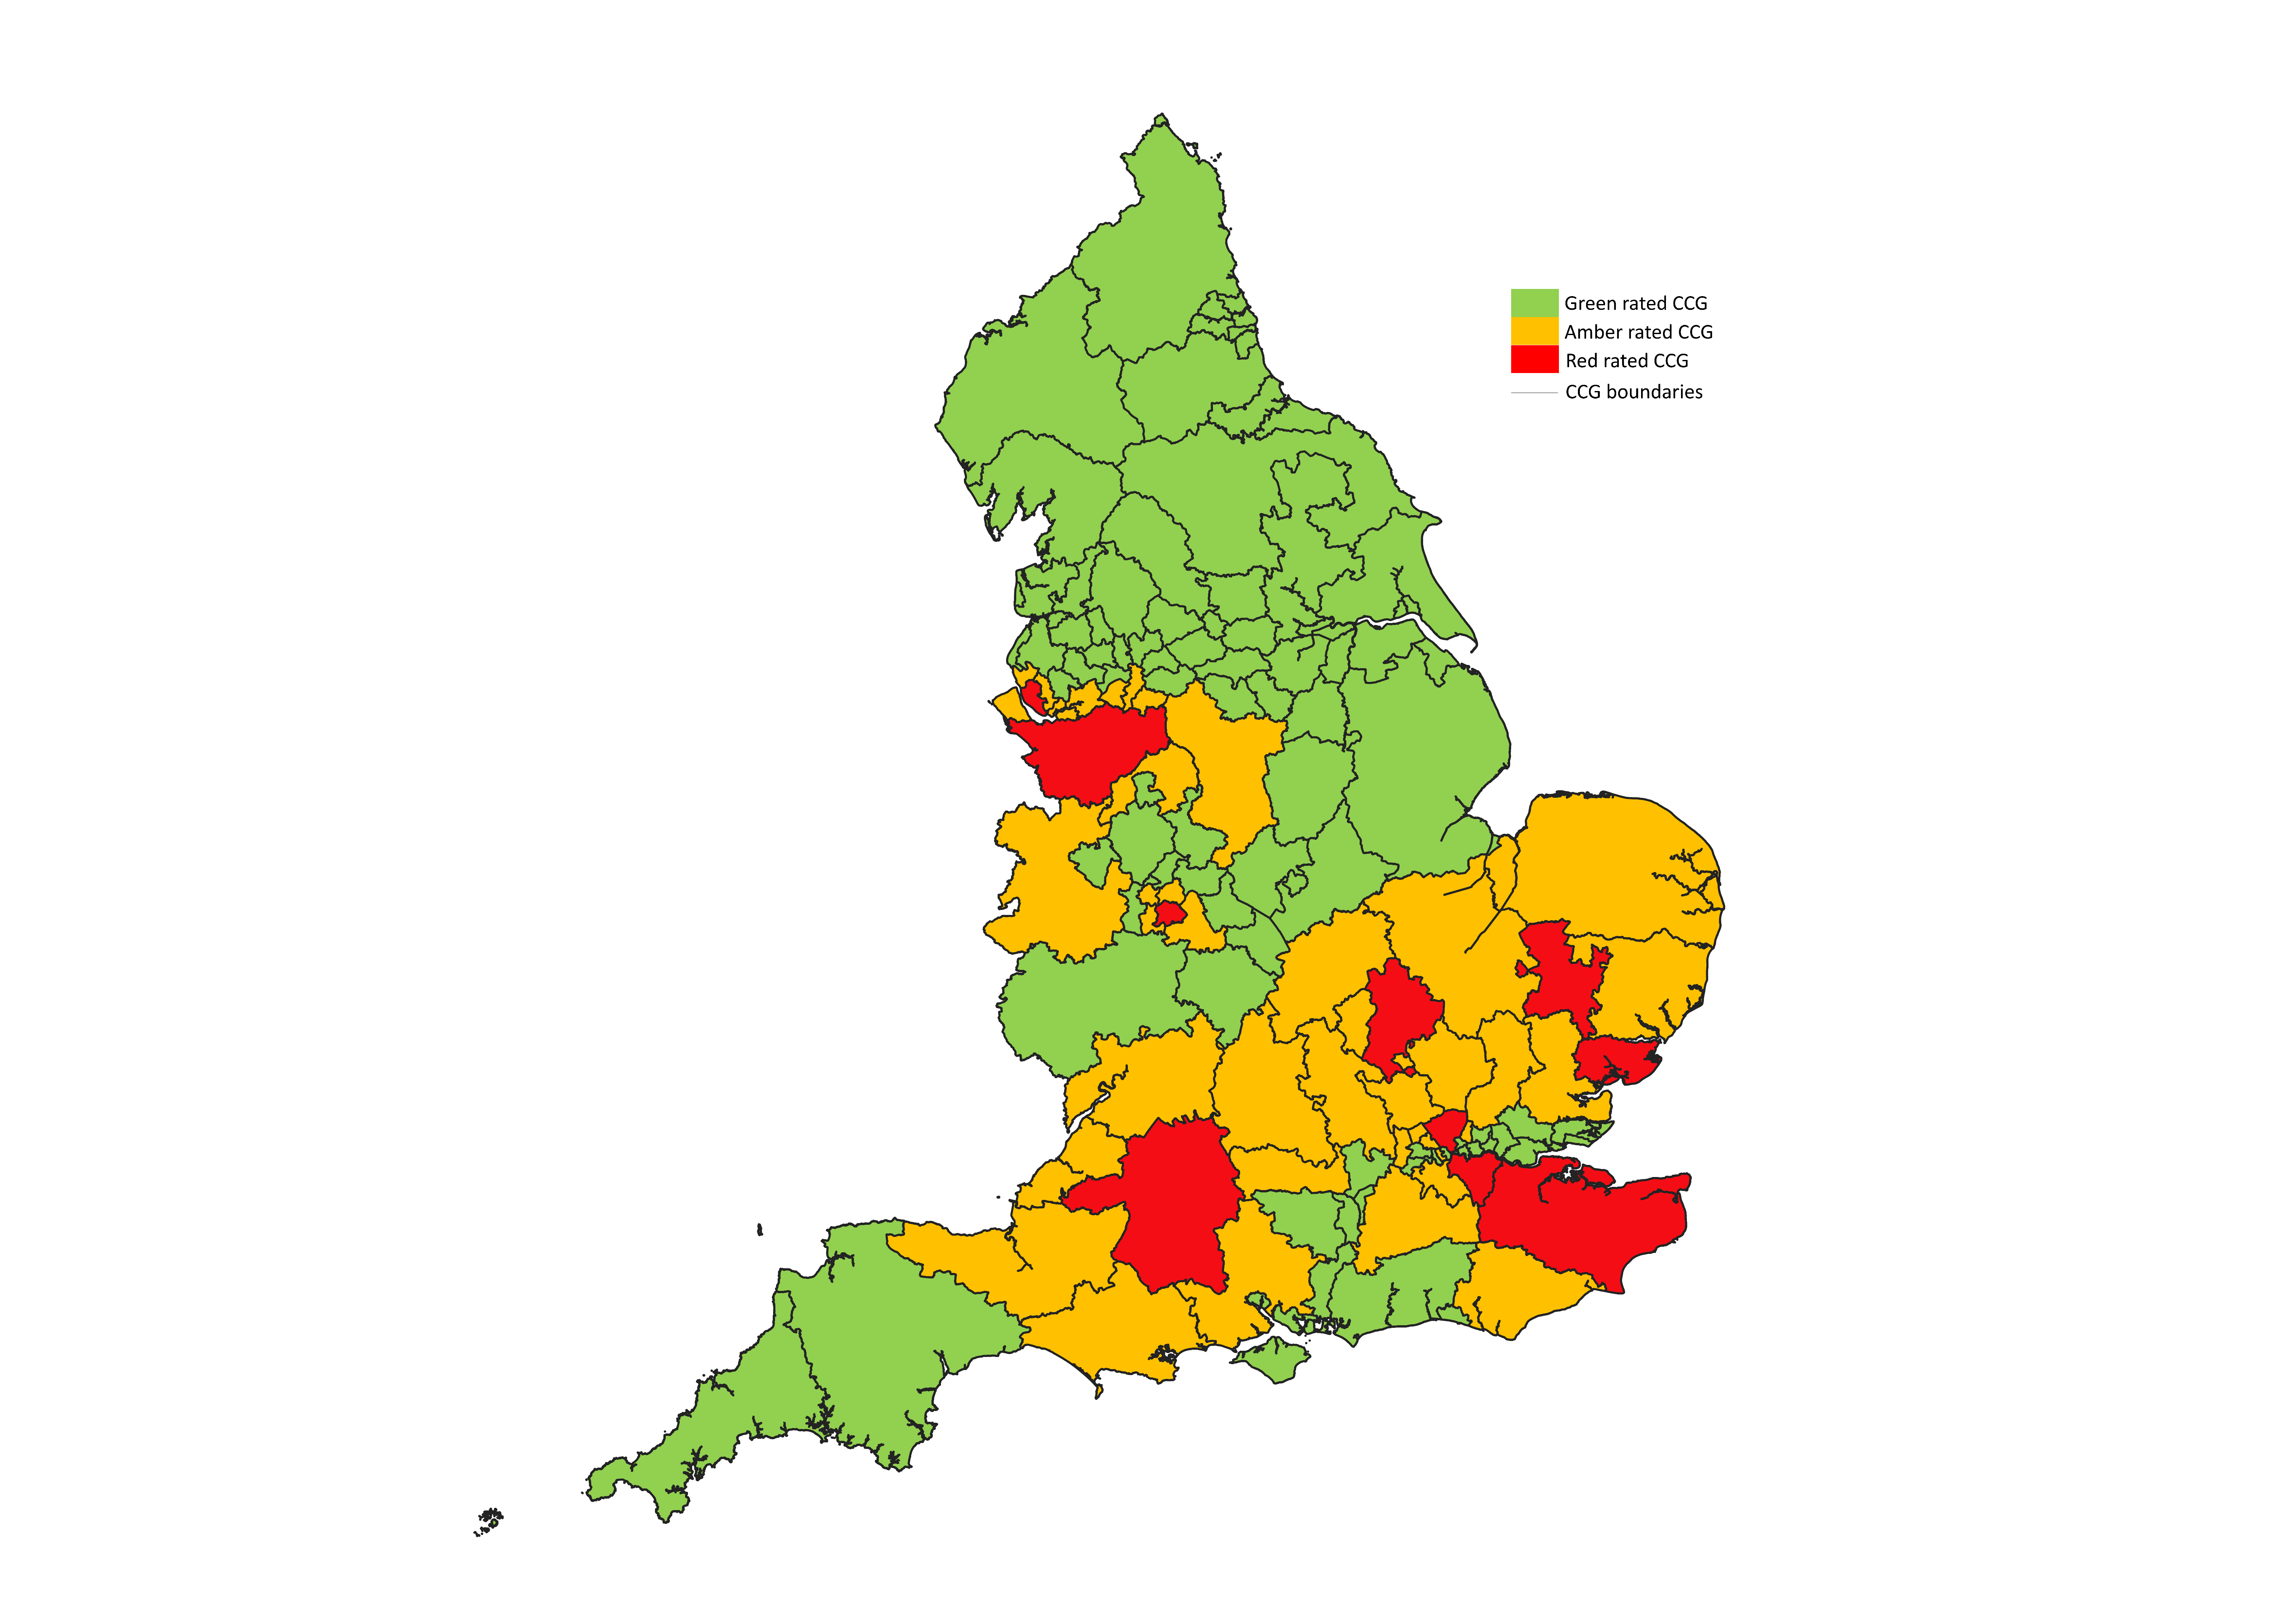
Figure 2. Estimated coverage of CCGs
This map represents the results in table 1 in a visual format showing CCGs estimated to be fully covered (GREEN), partially covered (AMBER) and not well covered (RED).